Table of Contents
With AI generated content flooding the internet and the upcoming Search Generative Experience about to shake things up, it’s getting harder and harder to stand out.
If your content doesn’t seem to be working like it used to and you are struggling to increase visibility and grow organic traffic, it might be time to add Digital PR to your marketing mix.
- You can’t prompt AI to produce Digital PR campaigns in a few clicks!
- Digital PR ensures you are providing unique, valuable content (that Google loves now more than ever!)
- It requires effort and creativity (this eliminates a ton of the competition!)
- They have the potential to secure high authority, high trust links that can be extremely difficult for competitors to acquire; improving your website’s domain authority in the process.
- Many third party journalists and writers could reference your brand, potentially on high traffic sites, improving your brand awareness and trust.
Here’s a detailed breakdown of how we put together a data-driven digital PR campaign that secured over 10 pieces of coverage and a TV interview with SBS Australia… so you can do the same.
The 5 Steps To Using A Data-Driven Digital PR Campaign To Get Quality Links & Media Coverage
- Step 1: Ideation
- Step 2: Data Collection
- Step 3: Data analysis and visualisations (for the insights and story angles)
- Step 4: Creating The Data-Driven Content Asset
- Step 5: Promotion
Step 1: Digital PR Campaign Ideation
Our goal for this campaign was to create a data-driven content led Digital PR campaign that would resonate with the media, attracting links and coverage. The desired outcome of this being that:
- We would have a strong Digital PR case study showing our work and thinking
- We would improve our link profile and domain authority (which supports SEO)
- We would improve trust from being featured in third party media stories and can say things like: “As seen in…”
The campaign needed to align with our brand and what we do, but also be aligned to a relevant trending topic that would appeal to journalists who would be interested in creating a story referencing our campaign.
Initial Brainstorming
The universal impact and interest in AI (trending topic), coupled with the fact the marketing industry is one of the most significantly affected (connection to brand and what we do), we thought this was a good point to dig in.
Note: We usually try to come up with 3 ideas in the initial brainstorming, for better comparison and evaluation. We’re not sharing the other 2 in this case study, just in case we decide to launch a campaign around one of them in the near future! 🙂
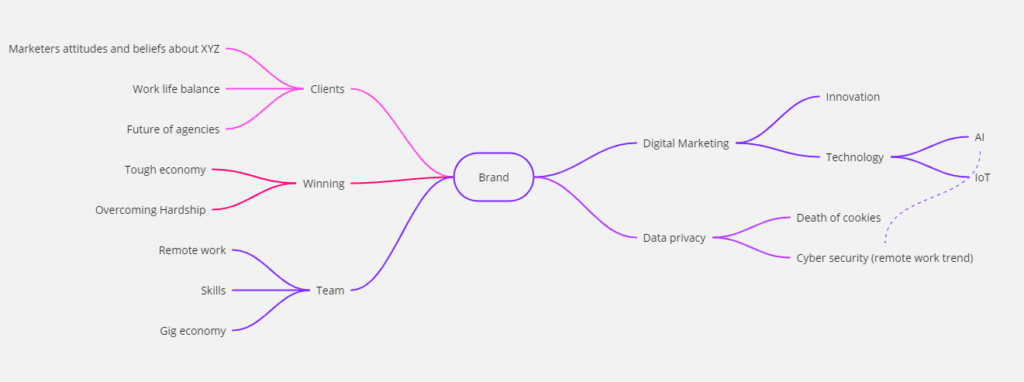
Pro Tip: Use a mind map diagram to help ideate potential campaign topics. Suggestion is to do this manually with a pen and paper, starting with the brand and not thinking too hard about it, just write the connections as they come to you. Do this for a solid 5-15 minutes then review. You’ll more than likely have several potential areas that are worth exploring further, while ensuring your connection is not too far away from your brand core.
Audience & Media Insight
Looking at our own audience, which includes white collar marketing professionals and entrepreneurs, they are intrigued by digital trends and their implications.
Concurrently, looking at journalist and media beats, it appeared as though there was a high interest and coverage around how AI technology is reshaping industries and employment, both now and hypothetically in the future.
We felt that for this campaign, we might get wider appeal if we ‘go up a level’ and use an audience of ‘white collar professionals’ and AI.
Gap Analysis in Existing Content
We conducted an extensive review of existing content and media coverage on AI. Our findings revealed a gap in data-driven insights into how AI is currently being adopted and perceived specifically within the white-collar sector in Australia.
Feasibility and Impact Assessment
Considering our resources, conducting a comprehensive survey was within our reach, thanks to online survey platforms. The potential impact of revealing new statistics and trends was deemed high, offering valuable insights for media, businesses and professionals.
Using the ICE framework can help you evaluate and decide on which idea to run with.
Final Campaign Idea:
To What Extent Are White Collar Australians Using AI in the Workplace?
Pro Tip: Thinking of the campaign as a question (that the data driven content answers) can help with ideation.
AI is an incredibly hot topic at the moment, and the ethics behind it in the workplace are being questioned. Businesses and their employees can use the technology to get ahead by speeding up processes, but to what extent, at what cost and how do people feel about it?
In this campaign, we decided to conduct a survey of white collar Australians asking them questions about how they use AI in their everyday work lives.
We’ll ask them which industries they work in, their seniority level and more, before asking them how often they use AI, if at all, if their company knows that they use it, what they use it for and the specific tools they use at work.
Pro Tip: Always ask questions that allow you to segment your audience by demographics and firmographics (if applicable) and if this isn’t included as standard – company size, gender, age, industry etc. This will allow you to extract insights and comparisons from the data… things that can make great hooks and story angles for media!
Step 2: Identify Your Data Source(s) – AKA Data Sets – And Collect The Data
You have a couple choices here, mainly:
- Collect from your own data
- Create the data
- Source from existing datasets
For this campaign we chose to create the data by way of a survey.
PollFish is a great platform for a couple reasons:
- Demographic and firmographic segments come included as standard
- Good filtering options to hone in on your target audience for the survey
- Reasonably priced – depends on number of people you want to survey, number of questions, filters (e.g white collar workers, Australian etc)
- Nice dashboard report with visualisations and ability to filter the data in addition to raw data export
For the media, you probably want 1,000+ people in the survey (ideally 2,000+) so it carries a level of statistical significance. We used 1,000 for this one to align with the available budget.
Other than the audience, the questions are the most important part to get right and can heavily influence the success of your Digital PR campaign.
Why?
Because the questions lead to the story angles that journalists might hook onto (and you want to make it as easy as possible for them to identify the angles for their story).
We started by thinking about a list of possible angles, then designed the survey questions to extract the data based on the angles.
Think comparisons and segments to help ideate good angles and lean on LLMs like ChatGPT for further ideas.
Some initial angles we came up with were:
- AI is being used by X in 10 (X%) of white collar Australians
- X% of Gen Z’ers are using AI in the workplace without their boss knowing
- X star sign is most likely to use AI at work without their boss knowing
- Australian white collar workers using AI for X hours a week
- X% of Aussies think AI actually generates the wrong answer for them
- 2 in 5 Aussies think we shouldn’t trust AI
- Older white collar Australians trust AI the least
- Employees in smaller companies use of AI vs employees in larger companies
- The average person is willing to spend $X on AI to save them X hours a week
- People in X region tend to use AI at work the most
- Men/women are more likely to use AI while at work
- People in senior roles are X times more likely to use AI than entry level employees
- Speculative questions around Elon Musk’s views and trust in AI aimed to spark debate.
Each question was deliberately chosen to uncover multifaceted insights into AI usage at work, while also embedding potential hooks for media stories. Here’s a breakdown of our strategic questionnaire:
- Broad Usage Inquiry:
- Question: “Do you ever use AI at work?”
- Intent: This opener was chosen to filter participants based on their interaction with AI, serving as a gateway to more detailed inquiries.
- Potential Angle: “X% of Australian office workers interact with AI daily.”
- Platform Identification:
- Multi-Choice Question (can select more than one): “Select which platforms you’ve previously used: ChatGPT, Claude, Bard / Gemini, MidJourney, Other, None of the above.”
- Intent: By listing specific AI tools, we aimed to map out the landscape of AI tools in use, providing a foundation for discussing tool diversity and specialisation in professional settings.
- Potential Angle: “ChatGPT leads as the top AI tool among Australian professionals.”
- Usage Frequency:
- Question: “How often do you use AI at work?”
- Intent: Understanding the frequency of AI use helped us gauge its integration into daily work life, revealing dependency levels on AI technologies.
- Potential Angle: A surprising X hours a week are saved by AI. This differs in companies <X employees vs companies with X+ employees
- Organisational Transparency:
- Question: “Does your company know you use AI?”
- Intent: We sought to explore the dynamics between individual AI usage and organisational awareness or policies, potentially uncovering a gap between personal initiative and corporate strategy.
- Potential Angle: “X% of Gen Z’ers use AI without their boss’s knowledge.”
- Effectiveness Assessment:
- Question: “Do you think AI generates correct answers for you?”
- Intent: This question aimed to evaluate participants’ trust in AI’s accuracy, directly impacting perceptions of reliability and utility.
- Potential Angle: “Despite advancements and usage, X% of Aussies doubt AI’s reliability in the workplace.”
- Work Impact Analysis:
- Question: “Do you think AI is making your job easier or more difficult?”
- Intent: By assessing whether AI is perceived as a facilitator or a complicator, we could better understand its real-world implications on productivity and job satisfaction.
- Potential Angle: “AI at work: More of a hindrance than a help for X% of Australians?”
- Futuristic Outlook:
- Question: “Elon Musk believes AI will mean humans no longer have to work, what do you think about this?”
- Intent: This question introduced a speculative element, inviting opinions on AI’s long-term societal impact, reflecting broader existential and ethical considerations.
- Potential Angle: “Future of work: X% of Australians fear AI’s impact on job security.”
- Time-saving Metrics:
- Question: “How much time does AI save you a week?”
- Intent: Quantifying time savings offered a tangible measure of AI’s efficiency benefits, a crucial selling point for technology adoption.
- Potential Angle: The unseen helper: AI saves Australians X hours at work weekly.”
- Trust Evaluation:
- Question: “Do you think we should trust AI?”
- Intent: Trust is fundamental to technology adoption. This inquiry sought to uncover deep-seated attitudes towards AI’s role and reliability in professional contexts.
- Potential Angle: “GenZ agrees with Boomers – Only X% of Australians fully trust AI.”
- Investment Willingness:
- Question: “How much would you be willing to spend on an AI platform to save you time?”
- Intent: Exploring willingness to invest provided insights into the perceived value of AI tools, highlighting cost versus benefit considerations.
- Potential Angle: “The price of efficiency: Australians willing to spend up to $X on AI for time savings.”
Each question is designed to serve dual purposes: to collect insightful data and to hint at narratives that media outlets find interesting.
From exploring AI’s daily influence in professional settings to dissecting societal attitudes towards future technology implications, our approach aims to spark conversations, challenge perceptions, and engage a broad audience and media.
Also note, the angles listed with the questions are potential angles at this point. When you get the data back, you will see more / different angles in addition so some of your initial angle ideas are likely remaining.
The final angles are identified from analysing the data.
Pro Tip: Don’t have too many questions as people will get sick of the survey and abandon it or start ticking anything just to get through it. 10 is a good number.
Also note, the angles listed with the questions are potential angles at this point. When you get the data back, you will see more / different angles in addition so some of your initial angle ideas are likely remaining.
The final angles are identified from analysing the data.
Step 3: Data analysis and visualisation for insights and story angles
Here is where you drill into findings, looking at how things compare between demographic and firmographic segments and if there are any outliers or surprising findings within the data.
Basically you’re looking for compelling story angles, insights and visualisations. Here’s an overview of the process:
Demographic / Firmographic Breakdown
We commenced our analysis by categorising the survey responses according to key demographic (age, gender, location) and firmographic (industry, company size, job role, seniority) parameters. This segmentation enabled us to tailor our insights to specific audiences and identify trends unique to certain groups.
Cross-Segment Comparisons
Comparative analyses helped to reveal how AI usage and perceptions varied across different segments. For instance, a notable comparison highlighted the generational trust in AI, revealing that Gen Z workers share a scepticism towards AI akin to that of Baby Boomers
Identifying Trends
Through trend analysis, we identified overarching patterns, such as a general increase in AI tool adoption with 86% of white-collar workers in Australia now using AI, underscoring its growing acceptance.
Outlier Detection
Our analysis was particularly attuned to detecting outliers or surprising findings. For example, we discovered an unexpected high usage rate of AI for non-traditional tasks, like creativity and brainstorming, challenging the notion that AI is solely a tool for analytical and repetitive tasks.
Deep Dives into Specific Questions
Each survey question underwent a deep-dive analysis to extract nuanced insights. For instance, when assessing if AI generates correct answers, we found that despite widespread use, there’s a notable scepticism about AI’s reliability, with only 40% of white-collar workers trusting AI. This indicates a gap between usage and trust, highlighting areas for improvement.
Sentiment Analysis
For open-ended responses, such as feedback on AI’s impact on job roles, we utilised sentiment analysis to gauge overall positive, neutral, or negative attitudes.
This provided a more layered understanding of workplace AI integration beyond mere statistical data. For instance, despite 66% believing AI makes their jobs easier, there remains a critical dialogue on its accuracy and trustworthiness, reflective of the sentiment that only 40% of Gen Z workers believe we should trust AI, a sentiment closely aligned with that of Baby Boomers.
The final list of key findings are below.
Key Findings
- 86% of white-collar workers in Australia use AI
- ChatGPT is by far the most popular AI tool with 72% of white-collar workers using it
- A typical Australian office worker spends 4.6 hours a week using AI tools
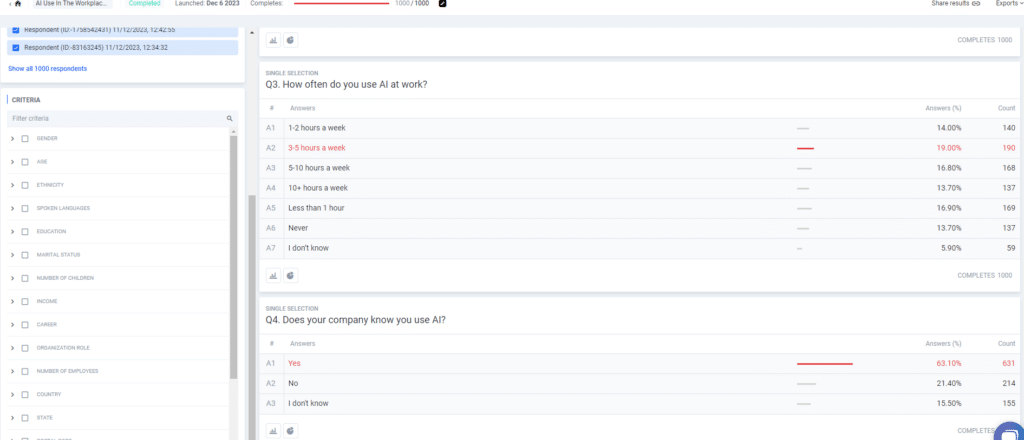
- One in five (21%) Australian office workers use AI in secret from their employer
- Four in ten Australian white-collar workers trust AI
- Two-thirds (66%) believe AI makes their jobs easier
- 40% of white-collar workers in Australia agree with Musk, that AI will positively impact society, others aren’t so sure
- 75% believe using AI saves them at least some time
- $60 per month is how much, on average, Australian office workers are prepared to spend on an AI tool or platform, provided it saves them time or makes their work easier.
- “I’m with Boomers on this one”: Gen Z Workers Sceptical About AI – Only 40% think we should trust AI and just 30% believe it generates correct and accurate answers
- In fact, in their attitudes towards AI, the youngest generation is much closer to Baby Boomers (aged 58+)
- A Self-Fulfilling Prophecy: The More Workers Use AI, The More They Trust It
- Diminishing returns: Sinking more time into AI doesn’t necessarily lead to greater time savings
- Using Both ChatGPT & Google’s Bard Results in Greatest Times Saving
- Despite being most widely used, ChatGPT users are most sceptical of its answers and AI in general
Pro Tip: Include these as a bullet point list at or near the top of your data-driven content piece. It allows the media to quickly spot story angles they could use and decide that it is worth their time exploring things further.
Data visualisations
This step is crucial in making the findings quickly accessible, engaging, and understandable to a broad audience, including media outlets.
Again, thinking about making their job of covering the story as easy as possible and providing clear, engaging visualisations that they can use in their stories often really helps with this.
Pro Tip: Elaborate and complex visuals are usually not recommended. Sometimes a creative and/or interactive visual can attract a lot of attention, but usually it’s best to keep it simple using bar charts, pie charts, line charts, tables and maps.
Choosing What to Visualise
We looked to identify the most compelling insights and comparisons that would benefit most from visual representation. We also considered the narratives and potential story angles that we wanted to emphasise and that we felt might appeal to the media when choosing which parts of the data to visualise with the content.
We aimed to simplify complex data and comparisons into clear, digestible visuals using a combination of bar charts, pie charts, tables, line charts and a map.
Step 4: Creating The Data-Driven Content Asset
This is the content asset that was central to the Digital PR campaign and posted on the Fusion Digital site. The place to house and explain all the key findings from the survey, weaved into a compelling narrative, complete with the visualisations, methodology and terms.
This content piece is what we will include in our pitch to the media and the point of reference as the source of the data and story (although they will often link back to your home page instead of the content asset – which is fine).
Identifying the Core Insights
The foundation of our content piece lay in the insights gleaned from the survey data. After the introduction which briefly and clearly explains the objective of the research, we list the key findings in bullet point fashion as mentioned earlier. This is so media can quickly and easily find the insights and possible angles without having to spend time reading through the findings.
Structuring the Narrative
With our core insights identified, we outlined a narrative structure that would guide our audience through our findings in a logical and engaging manner. The narrative was designed to not just relay data but to tell a story about the evolving role of AI in the professional lives of white collar Australians. We ensured the flow of content smoothly transitioned from introducing the topic, presenting the key findings, to a deeper exploration of some of these findings.
Visualisation for Clarity and Engagement
Using the visuals from the previous step, we embedded them in the content to break up the text, clearly communicate key points and support the narrative while improving the engagement of the piece.
Writing and Refinement
With a clear structure and visuals in place, we moved on to the writing phase. Leveraging LLMs like ChatGPT and Claude, we:
- Gave it a role (senior digital PR strategist)
- Provided it with information about the Fusion brand
- Provided it with information about the campaign, audience and objectives
- Provided it with the key insights from the survey data
- Provided it with some example data-driven content pieces similar to what we wanted to create
- Gave it a brief for the task we wanted it to carry out (create the content piece) and told it never to hallucinate and only use the data we provided it with
Acknowledging that the content would likely be longer than a single output, we instructed it to spread the response across multiple outputs, section by section.
Pro Tip: We actually didn’t do this with this particular campaign – at least not in the content piece itself (we did in the press release) – and there were reasons for that… but best practice is to try to incorporate quotes in your content. Quotes could be from an expert at your company, a 3rd party expert, survey respondents or people who meet the criteria of the audience that the survey was run to (who were not part of the survey). Media like quotes and commentary so it can help with coverage.
Finalising and Publishing
The final step in our content creation process involved a thorough review and finalisation phase, ensuring that every element of our content piece met our high standards for quality and coherence. Once finalised, the content was published on the Fusion Digital site, ready to act as a reference point for media and a valuable resource for anyone interested in the impact of AI on the workforce.
Step 5: Digital PR Campaign Promotion
The final step in our digital PR campaign centred around the promotion of our data-driven content piece on AI’s integration into the Australian white-collar workforce.
This phase was pivotal in getting the story in front of relevant media who might want to cover it.
We took a 3 step approach:
- Press Release Creation and Distribution
- Media Hit List and Manual Outreach
- LinkedIn InMail Campaign
Press Release Creation and Distribution
We crafted a compelling press release that succinctly summarised the key findings of our survey, emphasising insights that we felt would resonate most strongly with the media and public.
The press release highlighted the high usage of AI, notable scepticism among users, and the generational divides in AI perception, positioning these findings within the broader context of AI’s impact on productivity and workplace dynamics.
Having already trained the AI (ChatGPT and Claude) on the campaign when leveraging it to help create the content asset, we can use the same chat to lean on it again to help create the press release(s).
For widespread dissemination, we utilised the ‘Get The Word Out’ paid promotional service, ensuring our press release reached a broad audience. This resulted in several publications picking it up and running a story.
Pro Tip: Keep checking for mentions regularly and reach out to any that haven’t included a link (or linked to the wrong site as the source – a competitor – in one case. Thankfully they were quick to update it!). Also note that some media have a no links policy, but Google claims even coverage without the link is still valuable.
Media Hit List and Manual Outreach
Hit List Creation: We compiled a media hit list that included national and local media outlets, specialised tech and HR media, and other relevant publications. This list was curated based on their recent beat (what they are talking about) and the story angles from our data.
Manual Outreach: Beyond the automated press release distribution in the previous step, we engaged in manual outreach, personally contacting media outlets and journalists from our hit list. This personalised approach allowed us to tailor our pitch to each recipient, highlighting aspects of our findings most relevant to their audience and encouraging detailed coverage of our study.
LinkedIn InMail Campaign
Leveraging LinkedIn’s InMail paid advertising feature, we initiated a targeted campaign directed at journalists, reporters, and other media professionals in Australia with an identified interest in artificial intelligence (as specified in LinkedIn’s targeting).
This strategy enabled us to directly message relevant journalists and media workers on LinkedIn, providing them with top level insights from the data and inviting them to explore our findings further.
This also allowed us to test different messages and pitch angles to see what was resonating, so we could lean into the winning angles when pitching manually and with other marketing communications.
Another good thing about the LinkedIn InMail campaign was that it is a bit of an underused tactic (or so it seems), meaning your message stands out in their inbox (versus the hundreds of emails they receive each day). The message also stays in the inbox so they can easily refer back to it later.
Conclusion
It was from the LinkedIn campaign that we had SBS Australia reach out to us for a TV interview. One of the reporters had a current segment within a news show that featured AI every week and they wanted to interview us about the findings of our survey for next week’s segment.
A journalist from The Australian also reached out from the InMail ads.
The press release and manual outreach generated some coverage and links and in truth, we could have pushed the promotion a lot harder.
Curating a bigger hit list, including bloggers and influencers in addition to journalists and media and distributing additional press releases with different angles could all improve the amount of coverage.
That being said, 10+ links / coverage and a TV interview with a well known network was certainly a great outcome for this campaign!
As a Digital PR agency, we welcome any and all questions and thoughts. If you’re curious about the nuances of our campaign, or want to delve deeper into the details and how Digital PR could work for your business, we’re here to continue the conversation – just reach out and we’ll be happy to chat.